Wednesday, December 9, 2015
CMU student creates cool maps of Pittsburgh bike-share stats
Sure, the idea of riding bikes in December's sub-40 degree temperatures is not appealing for most. But maybe these maps and graphs will motivate you.
Mark Patterson, a Carnegie Mellon graduate student studying social and decision sciences, took one massive data file and turned it into maps and graphs that detail different aspects of Pittsburgh's bike-share system, Healthy Ride. In the bike-share’s opening three months, from June through August, Pittsburghers and tourists took about 40,000 rides combined, but Patterson wanted to see the intricacies.
“Ultimately it works great on both sides,” says Patterson. “We get a fun opportunity to explore, and they get a chance for more insight.”
 Patterson was intrigued by how far people rode (more than enough miles to circumnavigate the world), who rode late at night (see above), and how riders dealt with hills. For example, for every 26 riders who coasted downhill from Shadyside to Lawrenceville, only one rider braved the 200-foot-tall hill on the way back, according to Patterson.
“I live in Shadyside,” says Patterson, “and the bike ride down to Lawrenceville is great coasting, but the way back is not for the faint of heart.”
Patterson says that most of the data verifies what many already guessed — like how the majority of pick-ups are Downtown. But he notes there are some surprises.
When he first started to collect data on riders who pick up bikes from 11 p.m. to 4 a.m., he thought the South Side, with its bar scene, would have the highest percentage. However after compiling the data, the station at Maryland and Ellsworth avenues had 16 percent of its rides occur late at night. Patterson says Shadyside may have the best nightlife, at least among bikers.
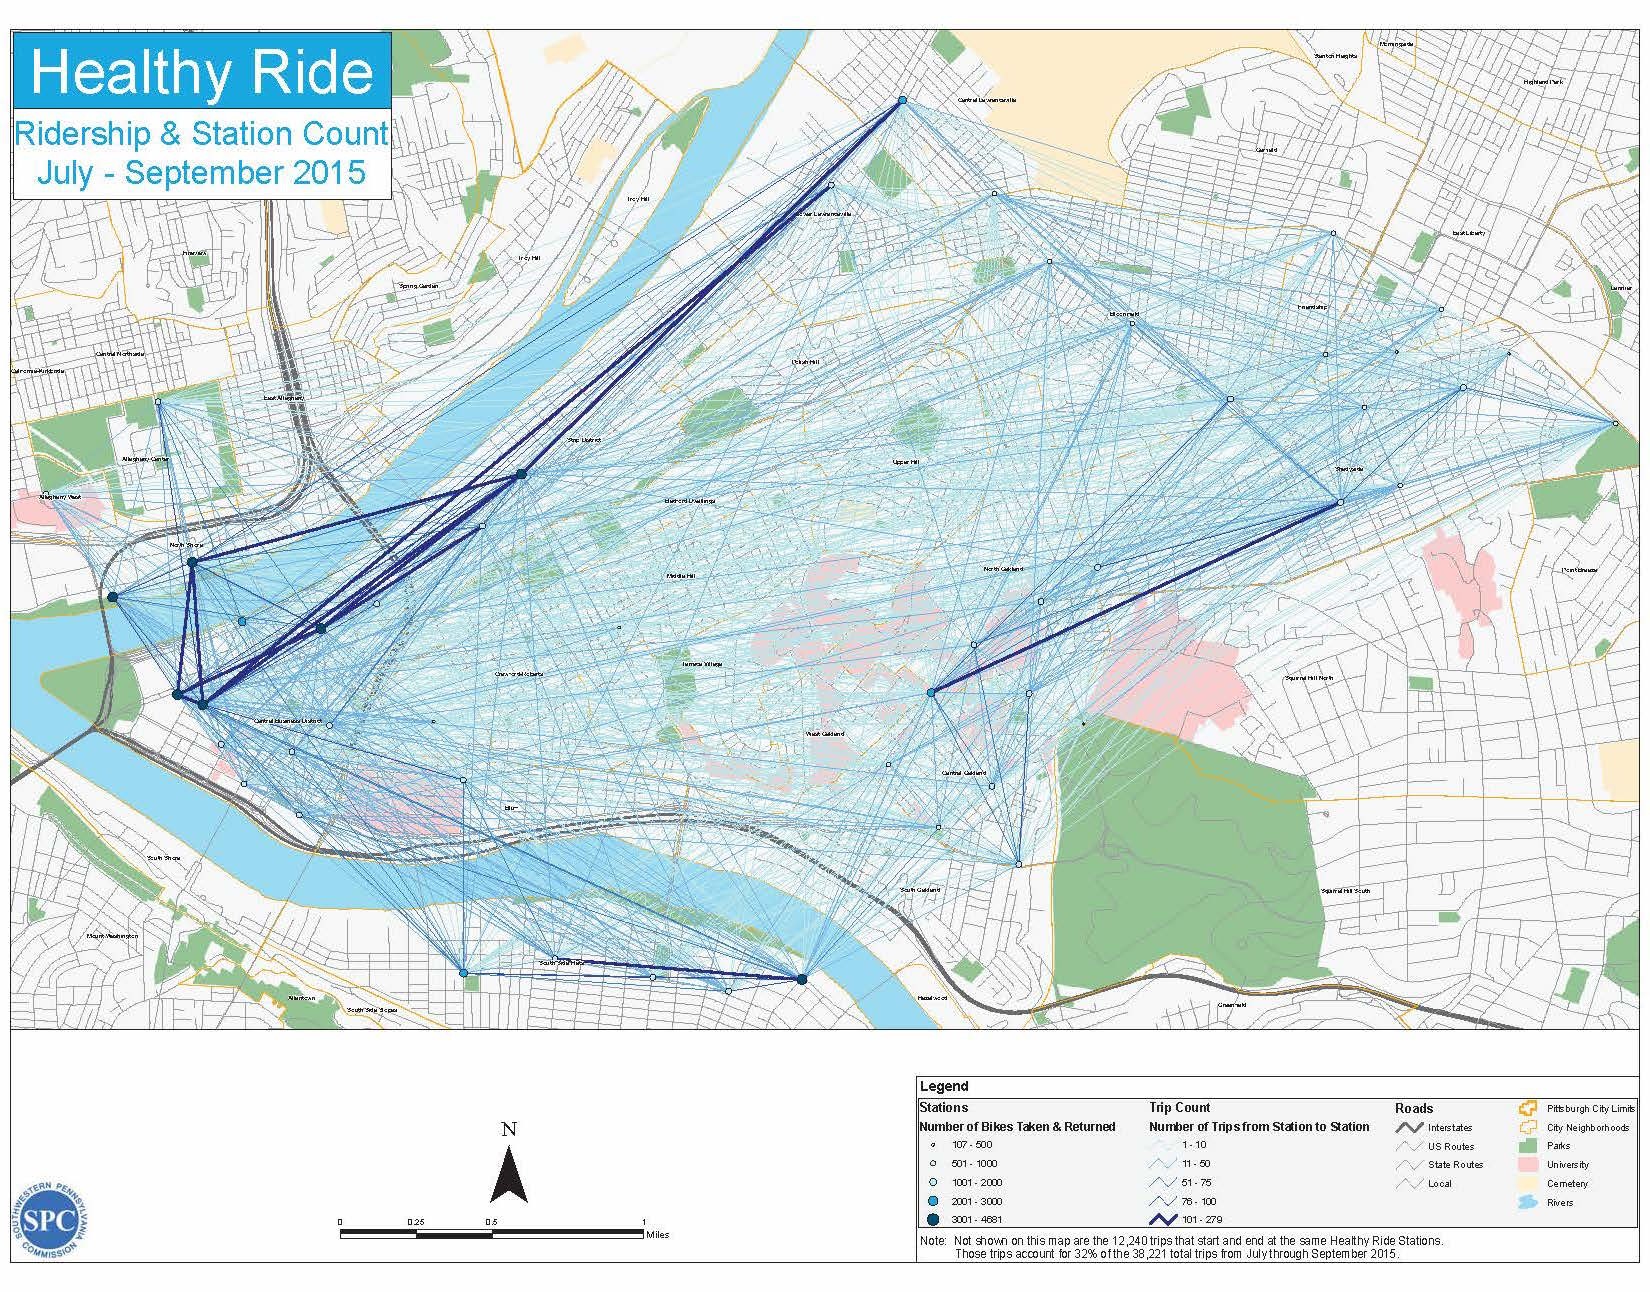
And Patterson is not the only one. The Southwestern Pennsylvania Commission also went crazy with the bike-share data. On the Healthy Ride website, the SPC posted a spider-web map of riders' routes, station by station. From this map we can see that the most popular routes are clustered along the Allegheny River and that Lawrenceville, already the headquarters of BikePGH and Healthy Ride, might have some additional proof that it is the city's unofficial biking capital.
To check out more bike-share maps, graphs and stats visit Patterson's twitter page and Healthy Ride's website.
Mark Patterson, a Carnegie Mellon graduate student studying social and decision sciences, took one massive data file and turned it into maps and graphs that detail different aspects of Pittsburgh's bike-share system, Healthy Ride. In the bike-share’s opening three months, from June through August, Pittsburghers and tourists took about 40,000 rides combined, but Patterson wanted to see the intricacies.
“Ultimately it works great on both sides,” says Patterson. “We get a fun opportunity to explore, and they get a chance for more insight.”

Image courtesy of Mark Patterson
Mapping the late-night rides of Pittsburgh
“I live in Shadyside,” says Patterson, “and the bike ride down to Lawrenceville is great coasting, but the way back is not for the faint of heart.”
Patterson says that most of the data verifies what many already guessed — like how the majority of pick-ups are Downtown. But he notes there are some surprises.
When he first started to collect data on riders who pick up bikes from 11 p.m. to 4 a.m., he thought the South Side, with its bar scene, would have the highest percentage. However after compiling the data, the station at Maryland and Ellsworth avenues had 16 percent of its rides occur late at night. Patterson says Shadyside may have the best nightlife, at least among bikers.
And Patterson is not the only one. The Southwestern Pennsylvania Commission also went crazy with the bike-share data. On the Healthy Ride website, the SPC posted a spider-web map of riders' routes, station by station. From this map we can see that the most popular routes are clustered along the Allegheny River and that Lawrenceville, already the headquarters of BikePGH and Healthy Ride, might have some additional proof that it is the city's unofficial biking capital.
To check out more bike-share maps, graphs and stats visit Patterson's twitter page and Healthy Ride's website.
Tags: Healthy Ride , bike share , Carnegie Mellon University , BikePGH , Southwestern Pennsylvania Commission , Image